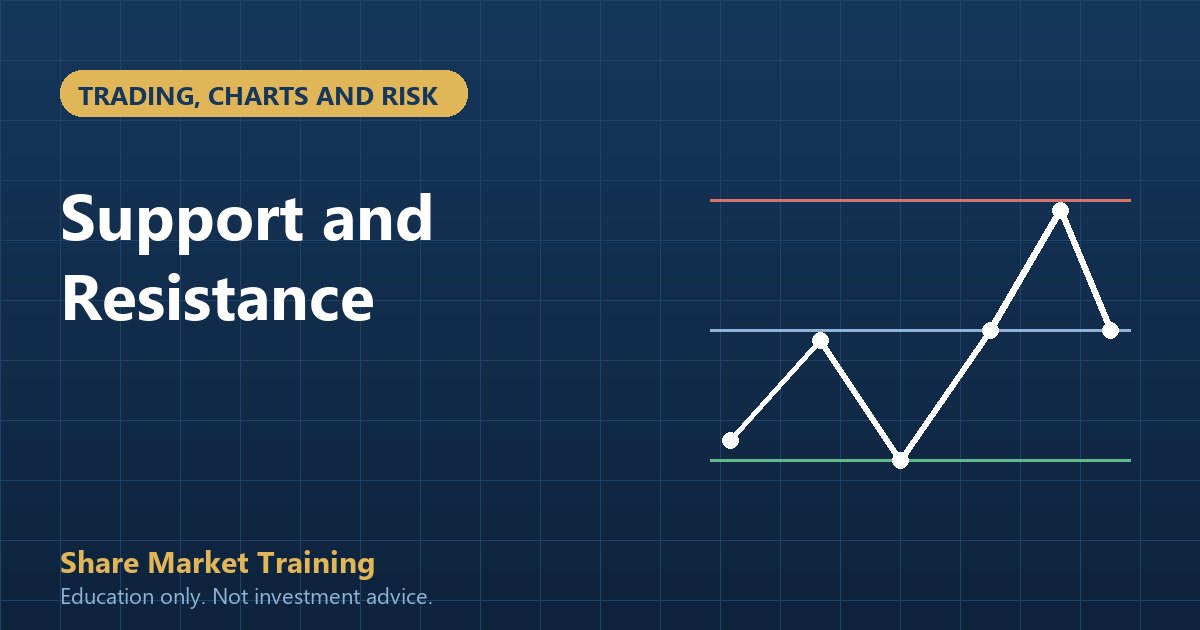
Support and resistance are the most widely taught idea in technical analysis and the most widely misused. Almost every beginner can draw a horizontal line on a chart. Far fewer can explain why a particular level should matter, when it should be ignored, and how to tell a genuine reaction from a coincidence drawn with hindsight.
A level is not magic. It is a price area where buyers and sellers have previously shown a willingness to transact in size. That history can influence behaviour because orders cluster around prices people remember: recent highs and lows, round numbers, the price where a previous rally failed. The influence is probabilistic, not mechanical, and that difference is what separates a useful level from a line on a chart.
Start with structure, not lines
Before drawing any horizontal level, identify the market structure: the sequence of swing highs and swing lows. An uptrend makes higher highs and higher lows. A downtrend makes lower highs and lower lows. A range makes overlapping swings with no clear progression. Almost every level that matters sits at one of these swing points, because that is where the market previously turned.
A swing high is a candle whose high is higher than the highs on either side; a swing low is the mirror image. The exact number of candles on each side is a parameter, not a law. On a daily chart, a three-bar swing is a reasonable start. The point is to identify the places where price reversed with enough force to be visible, not to label every minor wiggle.
Once the structure is marked, the levels suggest themselves. A resistance level is a prior swing high where selling appeared. A support level is a prior swing low where buying appeared. If the market is trending, the most relevant levels are the most recent swing points, not every level from the last five years.
How to draw a level that deserves attention
- Use the body and the wick, not a single price. A level is a zone of a few points or rupees, not a line to the fourth decimal. Plot it where the reaction occurred, using the candle bodies as the core and the wicks as the outer boundary.
- Prefer levels with more than one touch. A price that rejected the market twice is more interesting than a price that was touched once. More touches are not automatically better; a level tested many times can weaken as the orders that created it are absorbed.
- Look for a strong departure. A level that produced a large, fast move away is more meaningful than one where price drifted sideways. The reaction shows that size was transacted.
- Check the higher timeframe. A daily level that coincides with a weekly swing point is more significant than a five-minute level with no higher-timeframe context.
- Mark the obvious round numbers separately. Prices such as 25,000 on the Nifty or ₹1,000 on a stock attract orders because they are psychologically simple. They are not structural, but they can still produce reactions.
Support and resistance are roles, not fixed labels
A level that acted as resistance can become support after price breaks above it, and a support level can become resistance after a break below. The reason is behavioural: traders who sold at resistance may later buy back, and traders who bought at support may sell to avoid a larger loss. The level does not change; its role does.
This is why “the level broke, so it is no longer relevant” is often wrong. A break above resistance followed by a retest that holds is one of the more useful patterns in a trending market. The retest is the market checking whether the breakout has real demand behind it. A retest that fails, with price falling back below the level, is a warning that the breakout was a trap.
False breakouts and liquidity
Markets often trade briefly beyond an obvious level before reversing. This is not random. Stops are usually placed just beyond swing highs and lows, and large participants know where those stops are. A move through the level can trigger stop-loss orders and breakout buys, providing liquidity for a larger seller or buyer. The result is a sharp move beyond the level followed by a reversal back into the range.
You cannot know in advance whether a break is genuine. You can decide in advance how you will respond. One approach is to wait for a close beyond the level, then for a retest that holds, before acting. Another is to require a minimum distance beyond the level, measured in the instrument’s normal range, to filter out noise. Neither is perfect. Both are more disciplined than buying the first tick above a line.
Three ways to use a level
| Scenario | What you see | A disciplined response |
|---|---|---|
| Rejection at resistance | Price approaches a prior swing high and stalls, with a rejection candle or declining momentum. | Look for a defined invalidation above the level. If the distance to the stop is too wide relative to the target, skip the trade. |
| Break and retest | Price closes above resistance, pulls back to the level and holds. | Treat the retest as the decision point. A stop below the level defines the risk; a failure back below it invalidates the idea. |
| Range boundaries | Price oscillates between a clear support and resistance with no trend. | Trade the edges only if the range is wide enough to cover costs and the stop fits inside the range. Avoid the middle. |
Notice that each response includes a condition under which the idea is wrong. A level without an invalidation point is not a trade plan; it is an observation. The purpose of the level is to give you a place to be wrong that is close enough to make the trade affordable.
Levels and indicators are not rivals
A moving average can act as a dynamic level, and indicators such as RSI can describe momentum at a level. They are not substitutes for price structure. If a stock is at a major resistance level and RSI is overbought, the two observations agree; if RSI is overbought but price is breaking through resistance on strong volume, the indicator is telling you about the past, not the future. The level and the reaction in price are the primary evidence.
A chart-marking exercise you can do this week
Choose five liquid stocks and one index. Open the daily chart with at least a year of data. Mark the swing highs and lows using a three-bar rule, then draw only the two or three levels that produced the strongest departures. Write the levels in a notebook before the next session. During the session, do not move them. At the end of the week, review which levels produced a reaction, which were ignored and which were broken and retested.
The review is more important than the marking. Most beginners remember the levels that worked and forget the ones that did not, which creates false confidence. A simple table with the level, the date, the reaction and whether the reaction was tradeable at a sensible stop will show you quickly whether your level selection has any value. If every level looks important in hindsight but none were clear in advance, the problem is selection, not the market.
When levels stop working
Levels are context-dependent. In a strong trend, price can slice through several obvious levels without pausing, because the order flow is dominated by one side. In a news-driven market, a level that held for months can become irrelevant in a minute. A method that treats every historical level as equally valid will keep buying into a falling market or selling a rising one.
One practical filter is to require the level to align with the current structure. In an uptrend, favour support levels and break-and-retest setups in the direction of the trend; in a downtrend, favour resistance. Counter-trend level trades can work, but they need a stronger reaction and a tighter invalidation. If the market has just repriced on major news, stand aside until a new structure forms rather than assuming the old levels still apply.
The mistakes
- Drawing too many lines. A chart with twenty levels has no levels. Keep the three or four that are most relevant to the current structure.
- Hindsight drawing. If your level only looks right after the reaction, it is not a level; it is a story. Mark levels before the session and keep them.
- Ignoring the timeframe. A five-minute level inside a daily uptrend is a short-term decision, not a change in the trend.
- Assuming a level must hold. A level is a probability, not a promise. The stop exists because the level can fail.
- Trading every touch. Most touches are noise. A method needs a trigger, not just a line.
- Forgetting costs. A tight stop near a level can look attractive until brokerage and slippage are included.
- Levels come from real prior reactions, not from arbitrary lines.
- Structure first: swing highs and lows tell you where the levels are.
- Draw zones, not exact prices, and prefer levels with a strong departure.
- Support and resistance change roles after a break.
- False breaks are common because stops cluster beyond obvious levels.
- Every level needs an invalidation point and a cost check.
Practise on daily charts first. Mark the structure, draw the levels before the market opens, and record what happened without changing the lines afterwards. Twenty charts reviewed honestly will teach you more than a hundred patterns memorised from a video. The technical analysis course includes structured chart-marking exercises, and the candlestick guide explains the candles you will see at these levels. For the risk side, read position sizing.