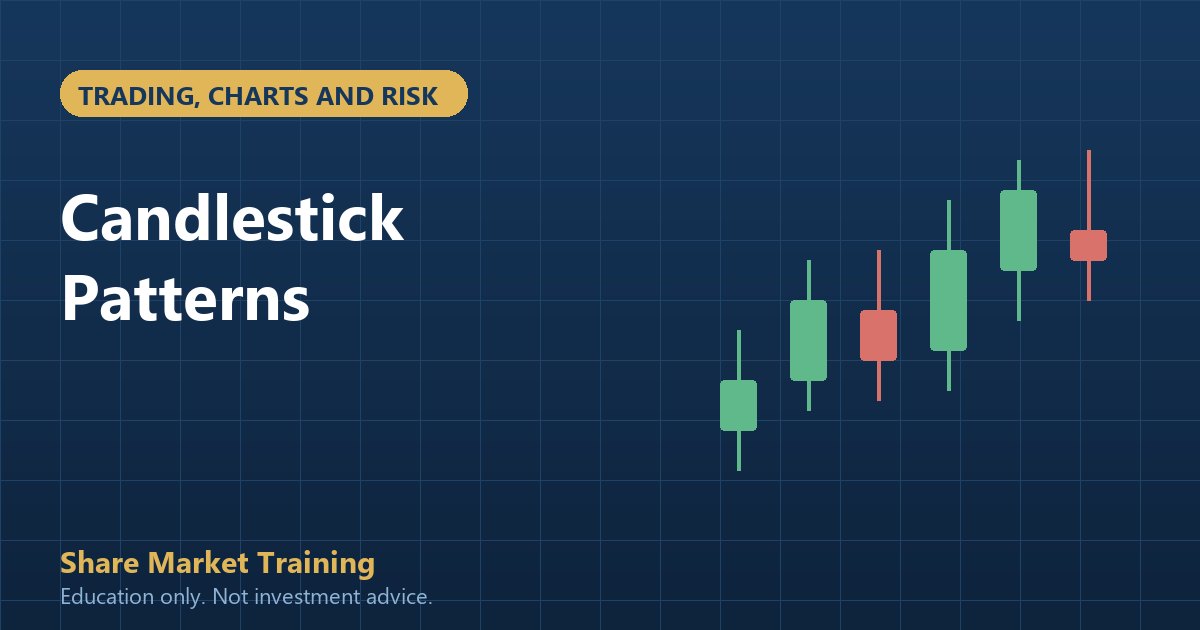
A candlestick packs four prices into one shape: the open, the high, the low and the close for a chosen period. A green or white candle means the close was above the open; a red or black candle means the close was below it. The body shows the distance between open and close, and the wicks show the extremes that were reached but not held.
That is the whole mechanical definition. The patterns that fill books and YouTube thumbnails are interpretations of these shapes in context. Some are useful. Many are overfitted to a handful of examples. This guide explains what candles actually encode, which patterns are worth learning first, and why the same candle can mean opposite things depending on where it appears.
Reading a single candle
| Shape | What it shows | A cautious interpretation |
|---|---|---|
| Long body, short wicks | One side controlled the period from open to close. | Momentum, but not a prediction; the next period can reverse. |
| Small body, long upper wick | Buyers pushed price up but sellers took it back before the close. | Selling pressure appeared at the highs; more meaningful at resistance. |
| Small body, long lower wick | Sellers pushed price down but buyers recovered it before the close. | Buying pressure appeared at the lows; more meaningful at support. |
| Doji (open and close nearly equal) | Indecision within the period. | A pause, not a signal by itself; context decides. |
| Marubozu (almost no wicks) | One side dominated the entire period. | Strong momentum, often continuation, but prone to exhaustion after a long run. |
A candle is a summary, not a story. The same long green candle can be a breakout confirmation at the start of a move or a climax near the end of one. Without the surrounding structure, the shape alone tells you very little.
Context: where the candle appears
The single most important variable is location. A hammer, which has a small body and a long lower wick, is often described as bullish. At a support level after a sustained decline, with the next candle confirming, it can be a useful warning that sellers are losing control. In the middle of a tight range, the same hammer is noise.
This is why learning patterns without learning structure is a trap. If you cannot identify whether the market is trending, ranging or transitioning, you cannot judge whether a pattern is meaningful. Start with swing highs and lows, support and resistance, and the direction of the higher timeframe. Then the candle becomes a detail within a context you already understand.
Our guide to support and resistance explains how to mark those levels before looking for candles. The sequence matters: structure first, level second, candle third, trigger fourth.
Five patterns worth learning first
- Hammer and shooting star. Small body with a long wick in the direction of the rejection. At support, a hammer suggests buyers defended the level; at resistance, a shooting star suggests sellers defended it. Require confirmation from the next candle or a break of the pattern’s high or low.
- Bullish and bearish engulfing. The second candle’s body completely covers the first. It shows a shift in control within two periods. More reliable after a trend has run and at a level, less reliable in the middle of a range.
- Morning star and evening star. A three-candle reversal pattern: a strong candle, a small indecision candle, then a strong candle in the opposite direction. The story is a transition from control by one side to control by the other. The pattern is only as good as the level it appears at.
- Inside bar. A candle entirely within the range of the previous one. It represents compression and often precedes expansion. It is not directional by itself; the break of the mother bar’s range provides the trigger.
- Pin bar at a level. A long wick that rejects a price and closes back inside the range. Like the hammer, it is a rejection signal, and its value depends on the level and the follow-through.
Patterns are not magic: the base rate problem
If you look at enough charts, you will find examples where a pattern worked. That does not mean the pattern has an edge. The question is how often it works compared with how often it appears, and whether the average win is larger than the average loss after costs. A pattern that works 60% of the time but loses twice as much on the 40% can still lose money.
This is why pattern study should include the failures. Mark every occurrence in a sample, not only the ones that worked, and record what happened next. The exercise is tedious and it is the difference between collecting shapes and building evidence. It is also the fastest cure for the belief that a particular candle is a guaranteed signal.
Candles on different timeframes
A daily candle summarises a full session; a five-minute candle summarises five minutes. A bullish engulfing on the daily chart is a different event from the same pattern on a five-minute chart, even though the shape looks identical. The daily pattern reflects a full day of positioning; the five-minute pattern may reflect a single large order.
A practical approach is to use the higher timeframe for context and the lower timeframe for execution. If the weekly chart is in an uptrend and the daily chart is pulling back to support, a bullish reversal candle on the daily or hourly chart can be the trigger. The higher timeframe reduces the number of false signals; the lower timeframe improves the entry and the stop distance.
Candles and indicators
Candles and indicators answer different questions. Candles show the path of price within a period; indicators summarise price over many periods. A candle pattern at a level can be confirmed by volume, but an indicator is not required. In fact, adding indicators to a candle signal often creates conflicting information and encourages discretion.
If you use an indicator, know what it calculates and what it cannot see. RSI does not know that a candle has a long wick; it only knows the closing prices. Volume can corroborate a breakout, but volume spikes also occur on news that reverses the next day. The candle is one input, not a complete system.
A chart-marking exercise
Pick one liquid stock and one index future. On the daily chart, mark twenty candles that look like a recognisable pattern: hammers, engulfing candles, dojis, inside bars. For each one, record the date, whether it appeared at a level, and what the next three candles did. Do not filter for the ones that worked. The objective is a base rate: out of twenty occurrences, how many produced a move large enough to cover costs with a sensible stop?
The exercise is humbling. Many patterns that look convincing in a book appear in the middle of nowhere on a real chart, and the follow-through is mixed. That is not a reason to abandon candles; it is a reason to use them as one input inside a structure-based method. The traders who persist are the ones who count the failures as carefully as the successes.
Volume as confirmation, not a signal
Volume tells you how much activity accompanied a candle. A breakout with unusually high volume suggests that more participants acted; a breakout on thin volume is easier to reverse. But volume is not a direction. A high-volume down day can mark capitulation or the start of a decline, and a high-volume up day can mark a genuine re-rating or a short squeeze.
Use volume to ask a question, not to answer one. If a candle at resistance breaks out on strong volume, the next question is whether the price holds above the level on a retest. If the volume is weak, the breakout deserves more scepticism. The candle, the level, the volume and the follow-through are four pieces of evidence, and no single piece is sufficient.
The mistakes
- Memorising names without context. A pattern is a description, not a strategy. Location and follow-through matter more than the name.
- Cherry-picking examples. Looking only at the winners in a chart is not evidence; count the failures too.
- Trading every doji. Indecision is common. Most dojis lead nowhere, and the costs of acting on all of them add up.
- Ignoring the timeframe. A five-minute pattern inside a daily downtrend is a counter-trend trade with a poor base rate.
- No invalidation. Every pattern needs a price at which the idea is wrong. Without it, the position has no size.
- Confusing a pattern with a prediction. The pattern describes what happened; it does not guarantee what happens next.
- A candle encodes open, high, low and close for a period.
- The same shape means different things at support, resistance and mid-range.
- Learn structure and levels before patterns.
- Count the failures, not only the examples that worked.
- Use the higher timeframe for context and the lower one for execution.
- Every pattern needs a defined invalidation point.
Candlesticks are a useful vocabulary, not a system. The technical analysis course teaches them inside a structure-first method, with chart-marking exercises and feedback. If you already trade and want to apply them to an end-of-day routine, the swing trading course shows how a daily candle fits into a multi-day position.